Air quality monitoring
On this page
The Council is responsible for monitoring ambient air quality within the borough, so that it can compare the pollution levels with national health-based objectives. These are set out within the National Air Quality Strategy (NAQS) which can be found on the DEFRA website.
The following air pollutants are monitored in the borough:
- nitrogen dioxide (NO2) and nitrogen oxides (NOx)
- particulate matter (PM10 and the finer fraction PM2.5)
- sulphur dioxide (SO2)
- ozone (O3)
- carbon monoxide (CO)
- benzene (C6H6)
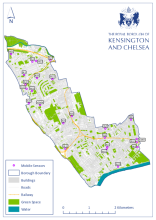
Air quality is currently monitored in over 100 locations across the borough. Five are permanent continuous monitoring locations, 80 are passive monitoring locations and 24 are mobile sensor locations. The following sections provide further detail around the boroughs air quality monitoring network.
If you have any queries about air quality monitoring, contact the Pollution Regulatory Team, email [email protected].

Continuous monitoring
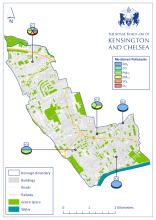
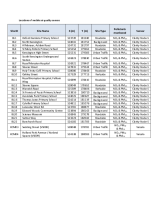
There are currently five permanent continuous monitors located within the borough (KC1 – KC5). These sites use accredited equipment, which are serviced and calibrated on a monthly basis to continuously monitor levels of pollutants such as nitrogen dioxide (NO2) and particulate matter (PM10). This type of monitoring is expensive to install and maintain but provides valuable real-time data. An overview of our monitoring locations can be found in the table below.
Our Local Site Operator (LSO) is currently Ricardo Energy & Environment who operate the Air Quality England network, so data from our continuous monitoring sites can be downloaded from the Air Quality England website. KC1 North Kensington is also a part of the Automatic Urban and Rural Network (AURN) supported by DEFRA. Data for this site is available on the Air Quality England website but also the AURN webpages.
Details of each of the monitoring locations can be found here:
| Site ID | Site Name | X (m) | Y (m) | Site Type | Pollutants Monitored | Monitoring technique |
|---|---|---|---|---|---|---|
|
KC1 |
North Kensington |
524041 |
181752 |
Urban Background, LAQN & AURN Affiliate Site |
NO2, CO, PM10, PM2.5, SO2, O3 |
Chemiluminescent, FIDAS, GFC, Fluorescence UV, Photometric |
|
KC2 |
Cromwell Road |
526520 |
178968 |
Roadside |
NO2, PM10 and PM2.5 |
Chemiluminescent, BAM PM10 & BAM PM2.5 (Beta ray attenuation) |
|
KC3 |
Knightsbridge |
527518 |
179395 |
Kerbside |
NO2 |
Chemiluminescent |
|
KC4 |
Chelsea |
527267 |
178089 |
Roadside |
NO2 |
Chemiluminescent |
|
KC5 |
Earl’s Court |
525695 |
178364 |
Kerbside |
NO2, PM10 |
Chemiluminescent, BAM 1020 |
Site type information
Kerbside = within 1 metre of a busy road
Roadside = 1-5 metres of a busy road
Urban background = an urban location distanced from pollution sources and therefore broadly representative of city-wide background conditions e.g. urban residential areas.
Passive monitoring

Diffusion tubes are used for passive monitoring as they are a simple low-cost way of measuring monthly average concentrations of pollutants which allows for a greater number of sites to be monitored. Currently diffusion tubes are used to monitor nitrogen dioxide (NO2) and BTEX concentrations. BTEX stands for the pollutants benzene, toluene, ethyl benzene and xylene.
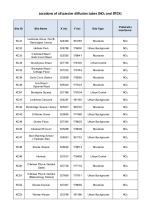
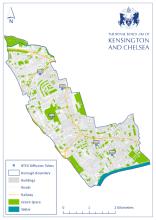
As shown in the picture to the right when deployed for sampling, the cap is removed from the bottom of the tube. The closed end (red cap) contains a pad which absorbs the pollutant being monitored. At the end of the sampling period (usually 4-5 weeks) the tubes are collected and sent off to a scientific laboratory for analysis. Although diffusion tubes are less accurate than continuous monitoring methods they still provide reliable data for monthly average concentrations and monthly trends. There are currently 79 NO2 diffusion tubes and 5 BTEX diffusion tubes located within the borough. Details of each of the monitoring locations can be found in the table below or within the Annual Status Reports on the Air Quality Reports and Documents page. There are three diffusion tubes at two of the NO2 diffusion tubes sites, KC47 and KC55, so there is a total of 79 NO2 diffusion tubes across 75 sites across the borough.
Mobile sensors
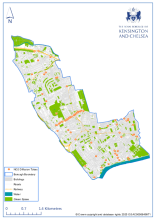
There are currently 24 mobile sensors within the borough. Two are owned by the council and managed by Ricardo Energy & Environment. Data from these can be viewed on the Air Quality England website.
The other 22 are part of the Breathe London network, run on behalf of the Mayor of London by the Environmental Research Group at Imperial College London. They also run the London Air Quality Network.
Details of each of the monitoring locations can be found in the table below or within the Annual Status Reports - visit Air Quality Reports and Documents.
Last updated: 31 July 2025

