People
Our residents
Kensington and Chelsea is the smallest borough in London both by size and population. It is home to 144,500 residents. Despite its size, the borough is remarkably diverse and densely populated, with a significant number of working age residents, people living alone, and single households.
While the number of children living in the borough is expected to decline, the population aged 65 or over is expected to increase in the next 20 years.
A lot of residents move in and out of the borough each year: 19 per cent of residents did not live at the same address as the year before. This is because of the large private rental sector (40 per cent of households). International migration is among the highest in England, more than 12,000 Kensington and Chelsea residents arrived in the UK in the past two years, nine per cent of the borough’s population.
36 per cent of residents are from Black, Asian, or minority ethnic backgrounds. From our local data, we have identified poorer health outcomes e.g. residents identifying from a Black ethnic background have almost double the rate of hypertension, over 3 times the rate of diabetes and 3 times the rate of obesity than those from a White background.
There are 80 languages spoken in Kensington and Chelsea, and 24 per cent of residents do not have English as their main language. French is the most spoken language after English, but it is different across the borough. In the 2021 Census, just over one per cent of residents reported that they could not speak English well or at all.
The most common religions in the borough are Christianity (48 per cent) and Islam (12 per cent). In the 2021 Census there was also an increase in residents who say they have no religion (from 21 per cent to 25 per cent). Those who identified as Muslim or 'other religion' are more likely to say their health is bad or very bad.
Our diverse borough…
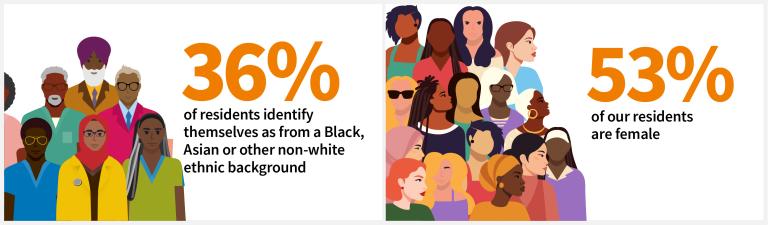
- 36% of our residents are from a Black, Asian or other minority ethnic background.
- 53% of our residents are female.
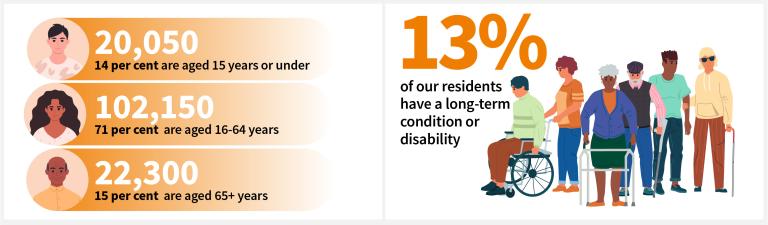
- 20,050 (14%) are aged 0-15 years, 102,150 (71%) are aged 16-64 and 22,300 (15%) are aged 65+.
- 13% of our residents have a long-term condition or disability.
- 1 in 25 residents identify as being LGBTQ+.
- 65% of residents have a religion.
- Just over 0.5% (685 residents) have a gender identity different from their sex registered at birth.
- 36% are married or in a registered civil partnership

